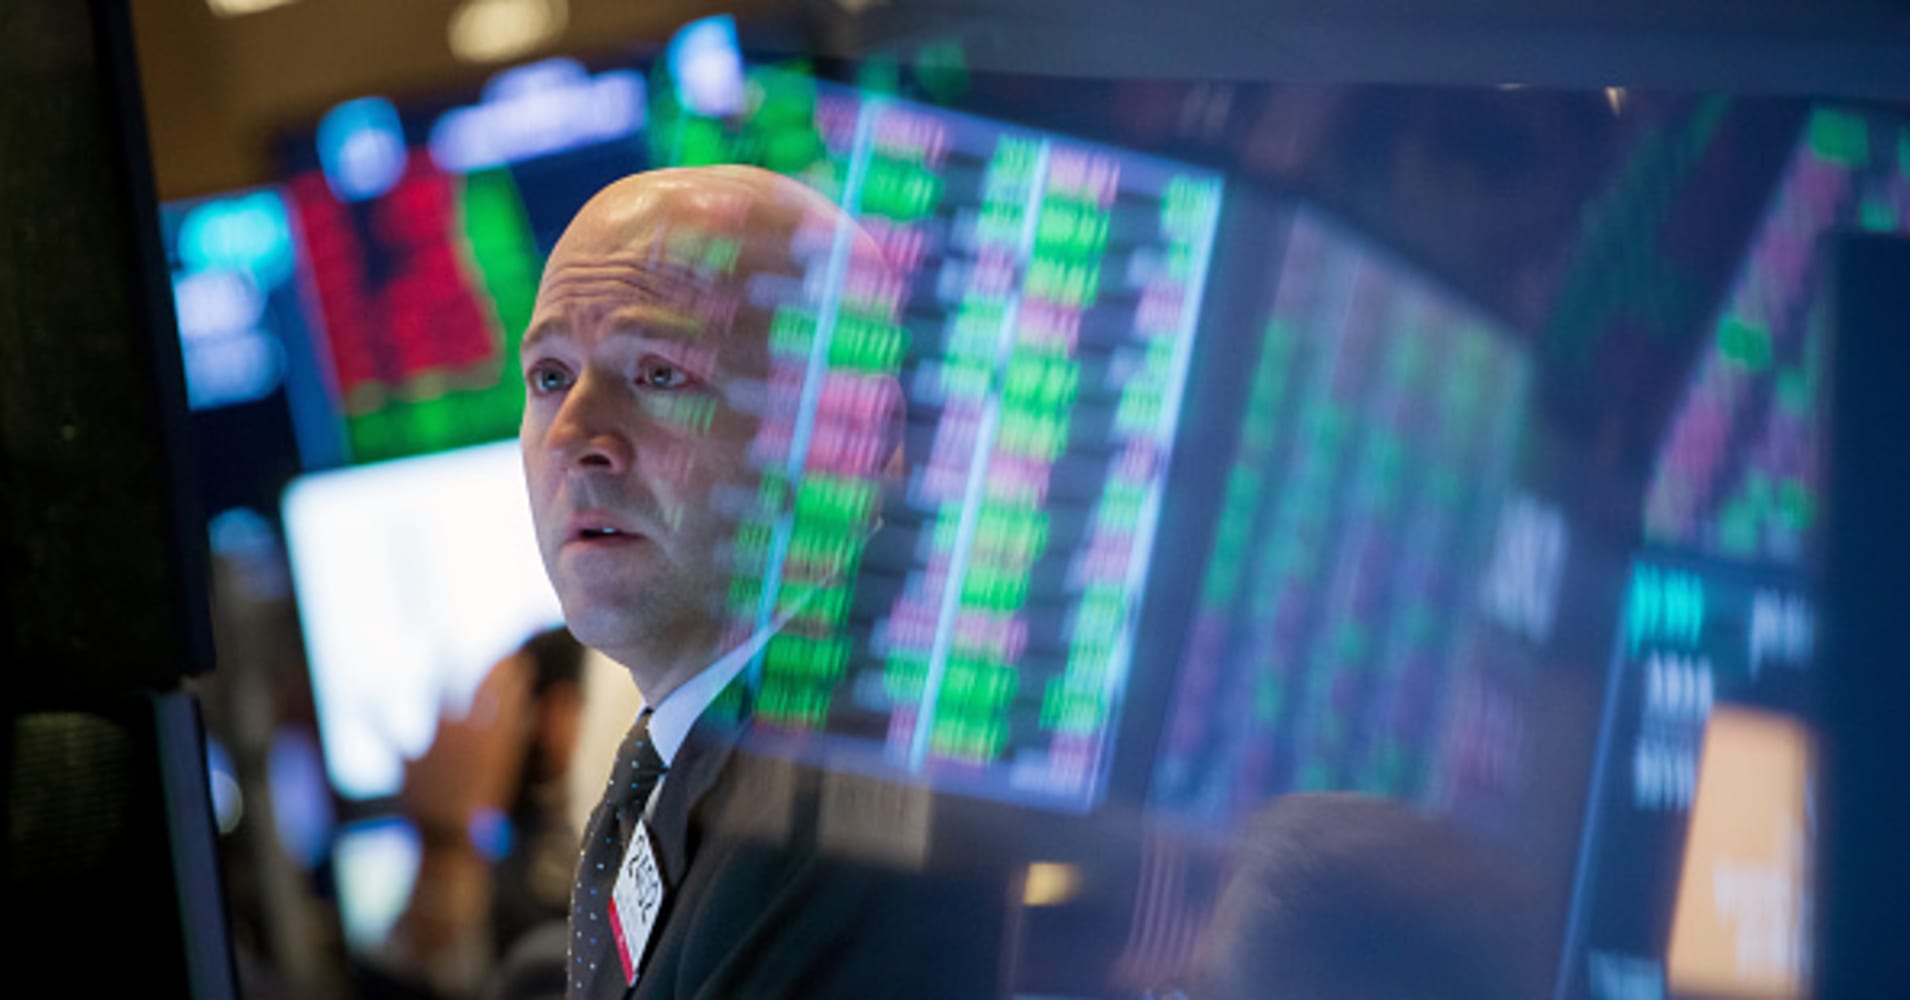
For investors who are waiting for cues to buy and sell stocks, the so-called “smart money” is saying jump in, according to a classic indicator on Wall Street.
Over the past 12 trading days, the S&P 500, on average, traded lower in the first hour, while it traded higher in the last hour of the day, according to Bespoke Investment Group. This is a change from what happened in December and a sign that the so-called smart money could be backing this market comeback.
The indicator holds that the more measured “smart money” investors tend to trade in the last hour of a given trading day after digesting the price action, while the emotional “dumb money” often trades in the first hour, reacting hastily on news events. The technical indicator was invented in the 1990s by money manager Don Hayes.
“From late September through Christmas Eve, the S&P 500 tended to open near the unchanged level but then drift lower throughout the trading session finishing near its lows of the day. Since Christmas, though, it’s been nearly the exact opposite,” Paul Hickey, Bespoke’s co-founder said in a note on Monday.
Bespoke found that the S&P 500 has traded higher in the last hour nine of the last 12 trading days, twice the rate of the pre-Christmas period. The benchmark dropped more than 9 percent in its worst December since the Great Depression.
“Leading up to Christmas, the trend of this indicator was definitely pointing in the bearish direction. The recent tone during the last two and a half weeks has definitely taken a turn in the bulls favor,” Hickey added.
To be sure, as the algorithmic, trend-following investment models have gained popularity on Wall Street, it’s hard to say how telling the “smart money” gauge is nowadays.
Generally though, traders still believe its bullish when the market rallies into the close.
Be the first to comment